Canadian Home Sales Edge Upward in August

Carola Singer • October 3, 2018

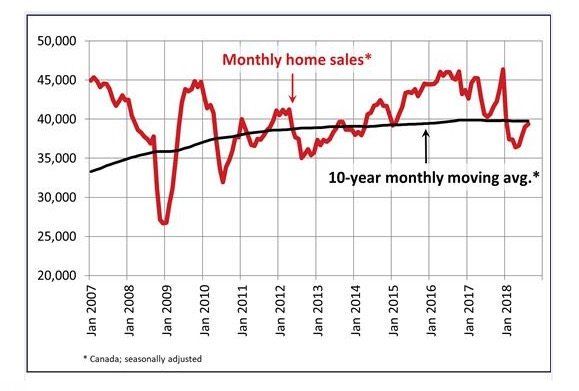
The Canadian housing market showed continued signs of stabilizing last month with sales edging upward and prices easing a bit. National home sales increased 0.9% in August, the fourth consecutive monthly gain. Sales in Toronto advanced 2.2% while they rose 2.9% in Vancouver. Nevertheless, the pace of sales activity remains below levels in most other months going back to 2014 (see chart below). As well, recent monthly sales increases are diminishing, which could mean that the recent rebound, particularly in Ontario, could be running out of runway.

The housing market has been recovering from steep sales declines early this year after federal regulators imposed stricter mortgage lending rules and the central bank raised borrowing costs. Home sellers also seem to be lowering prices for homes, fueling demand.

Roughly half of all local markets posted an increase in sales from July to August, led again by the Greater Toronto Area (GTA), along with gains in Montreal and Edmonton. Sales in the major urban areas of BC declined by 3.8% year-over-year (y/y) in August. The housing market in BC has slowed considerably since the February provincial budget hiked the foreign purchase tax and suggested a speculation tax could be introduced in the fall.

New Listings

The number of newly listed homes was unchanged between July and August, as new supply gains in the Greater Vancouver Area (GVA) and Montreal offset declines in the GTA and Winnipeg.

With sales up slightly and new listings unchanged, the national sales-to-new listings ratio edged up to 56.6% in August compared to 56.2% in July. The long-term average for this measure of market balance is 53.4%.

Based on a comparison of the sales-to-new listings ratio with the long-term average, about two-thirds of all local markets were in balanced market territory in August 2018.

There were 5.2 months of inventory on a national basis at the end of August 2018, right in line with the long-term average for the measure.

Home Prices

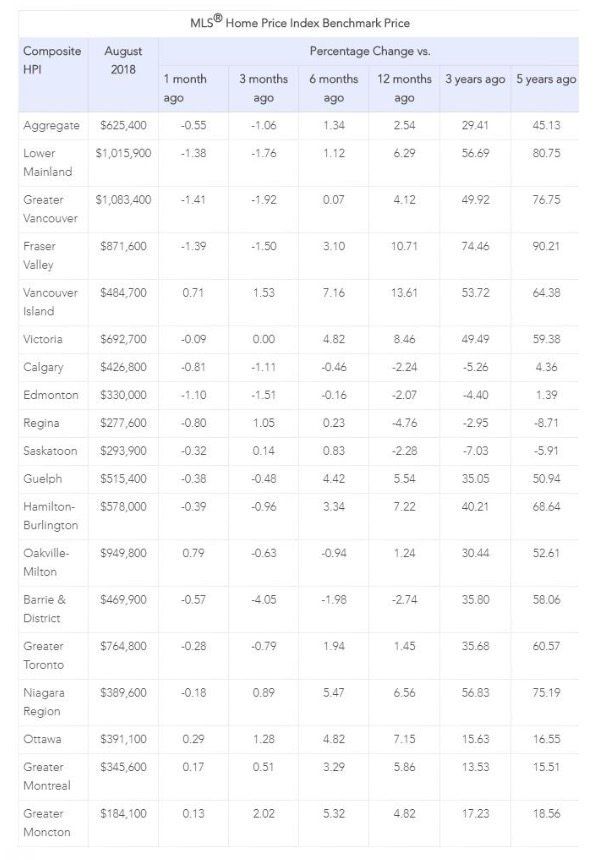
The Aggregate Composite MLS® Home Price Index (MLS® HPI) was up 2.5% y/y in August 2018, well below the booming pace in 2016 and early 2017. Benchmark home prices fell by 0.6% from July to August, the biggest decline since August of last year. The price decline was driven by Vancouver, where prices dropped 1.4%, the most significant monthly drop in a decade. Toronto home prices fell 0.3% in August.

Condo apartment units posted the most substantial y/y price gains in August (+9.5%), followed by townhouse/row units (+4.3%). Meanwhile, one-storey and two-storey single-family home prices were little changed on a y/y basis in August (+0.4% and -0.4% respectively).

Trends continue to vary widely among the 17 housing markets tracked by the MLS® HPI. Home price gains are diminishing on a y/y basis in the Lower Mainland of British Columbia (GVA: +4.1%; Fraser Valley: +10.7%). Prices in Victoria were up 8.5% y/y in August. Elsewhere on Vancouver Island, prices climbed 13.6%.

Among the Greater Golden Horseshoe (GGH) housing markets tracked by the index, home prices were up from year-ago levels in Hamilton-Burlington (+7.2%), the Niagara Region (+6.6%), Guelph (+5.5%), the GTA (+1.4%) and Oakville-Milton (+1.2%). By contrast, home prices remained down on a y/y basis in Barrie (-2.7%).

In the Prairies, benchmark home prices remained down on a y/y basis in Calgary (-2.2%), Edmonton (-2.1%), Regina (-4.8%) and Saskatoon (-2.3%).

Meanwhile, home prices rose by 7.1% y/y in Ottawa (led by an 8.2% increase in two-storey single-family home prices), by 5.9% in Greater Montreal (driven by a 6.3% increase in two-storey single-family home prices) and by 4.8% in Greater Moncton (led by a 7.5% increase in two-storey single-family home prices). (see Table below)

Bottom Line

Housing markets continue to adjust to regulatory and government tightening as well as to higher mortgage rates. The speculative frenzy has cooled, and multiple bidding situations are no longer commonplace in Toronto and surrounding areas. The housing markets in the GGH appear to have bottomed, and supply constraints may well stem the decline in home prices in coming months. The slowdown in housing markets in the Lower Mainland of BC accelerated last month as the sector continues to reverberate from provincial actions to dampen activity, as well as the broader regulatory changes and higher interest rates.

Since the implementation of new mortgage standards, nonprice lending conditions for mortgages and home equity lines of credit have also tightened. Additional rate hikes by the Bank of Canada are coming this fall, likely in late-October if the NAFTA negotiations appear to be progressing. The economy is running at full capacity, unemployment is low, and incomes are rising. Inflation is expected to return to the Bank of Canada’s 2% target, and uncertainty regarding trade with the US remains, but the central bank will continue to cautiously raise its trend-setting interest rate through the end of next year.

This article was written by Dr. Sherry Cooper DLC’s Chief Economist.

RECENT POSTS 

By Carola Singer September 17, 2025
Bank of Canada lowers policy rate to 2½%. FOR IMMEDIATE RELEASE Media Relations Ottawa, Ontario September 17, 2025 The Bank of Canada today reduced its target for the overnight rate by 25 basis points to 2.5%, with the Bank Rate at 2.75% and the deposit rate at 2.45%. After remaining resilient to sharply higher US tariffs and ongoing uncertainty, global economic growth is showing signs of slowing. In the United States, business investment has been strong but consumers are cautious and employment gains have slowed. US inflation has picked up in recent months as businesses appear to be passing on some tariff costs to consumer prices. Growth in the euro area has moderated as US tariffs affect trade. China’s economy held up in the first half of the year but growth appears to be softening as investment weakens. Global oil prices are close to their levels assumed in the July Monetary Policy Report (MPR). Financial conditions have eased further, with higher equity prices and lower bond yields. Canada’s exchange rate has been stable relative to the US dollar. Canada’s GDP declined by about 1½% in the second quarter, as expected, with tariffs and trade uncertainty weighing heavily on economic activity. Exports fell by 27% in the second quarter, a sharp reversal from first-quarter gains when companies were rushing orders to get ahead of tariffs. Business investment also declined in the second quarter. Consumption and housing activity both grew at a healthy pace. In the months ahead, slow population growth and the weakness in the labour market will likely weigh on household spending. Employment has declined in the past two months since the Bank’s July MPR was published. Job losses have largely been concentrated in trade-sensitive sectors, while employment growth in the rest of the economy has slowed, reflecting weak hiring intentions. The unemployment rate has moved up since March, hitting 7.1% in August, and wage growth has continued to ease. CPI inflation was 1.9% in August, the same as at the time of the July MPR. Excluding taxes, inflation was 2.4%. Preferred measures of core inflation have been around 3% in recent months, but on a monthly basis the upward momentum seen earlier this year has dissipated. A broader range of indicators, including alternative measures of core inflation and the distribution of price changes across CPI components, continue to suggest underlying inflation is running around 2½%. The federal government’s recent decision to remove most retaliatory tariffs on imported goods from the US will mean less upward pressure on the prices of these goods going forward. With a weaker economy and less upside risk to inflation, Governing Council judged that a reduction in the policy rate was appropriate to better balance the risks. Looking ahead, the disruptive effects of shifts in trade will continue to add costs even as they weigh on economic activity. Governing Council is proceeding carefully, with particular attention to the risks and uncertainties. Governing Council will be assessing how exports evolve in the face of US tariffs and changing trade relationships; how much this spills over into business investment, employment, and household spending; how the cost effects of trade disruptions and reconfigured supply chains are passed on to consumer prices; and how inflation expectations evolve. The Bank is focused on ensuring that Canadians continue to have confidence in price stability through this period of global upheaval. We will support economic growth while ensuring inflation remains well controlled. Information note The next scheduled date for announcing the overnight rate target is October 29, 2025. The Bank’s October Monetary Policy Report will be released at the same time.
By Carola Singer September 10, 2025
Can You Afford That Mortgage? Let’s Talk About Debt Service Ratios One of the biggest factors lenders look at when deciding whether you qualify for a mortgage is something called your debt service ratios. It’s a financial check-up to make sure you can handle the payments—not just for your new home, but for everything else you owe as well. If you’d rather skip the math and have someone walk through this with you, that’s what I’m here for. But if you like to understand how things work behind the scenes, keep reading. We’re going to break down what these ratios are, how to calculate them, and why they matter when it comes to getting approved. What Are Debt Service Ratios? Debt service ratios measure your ability to manage your financial obligations based on your income. There are two key ratios lenders care about: Gross Debt Service (GDS) This looks at the percentage of your income that would go toward housing expenses only. 2. Total Debt Service (TDS) This includes your housing costs plus all other debt payments—car loans, credit cards, student loans, support payments, etc. How to Calculate GDS and TDS Let’s break down the formulas. GDS Formula: (P + I + T + H + Condo Fees*) ÷ Gross Monthly Income Where: P = Principal I = Interest T = Property Taxes H = Heat Condo fees are usually calculated at 50% of the total amount TDS Formula: (GDS + Monthly Debt Payments) ÷ Gross Monthly Income These ratios tell lenders if your budget is already stretched too thin—or if you’ve got room to safely take on a mortgage. How High Is Too High? Most lenders follow maximum thresholds, especially for insured (high-ratio) mortgages. As of now, those limits are typically: GDS: Max 39% TDS: Max 44% Go above those numbers and your application could be declined, regardless of how confident you feel about your ability to manage the payments. Real-World Example Let’s say you’re earning $90,000 a year, or $7,500 a month. You find a home you love, and the monthly housing costs (mortgage payment, property tax, heat) total $1,700/month. GDS = $1,700 ÷ $7,500 = 22.7% You’re well under the 39% cap—so far, so good. Now factor in your other monthly obligations: Car loan: $300 Child support: $500 Credit card/line of credit payments: $700 Total other debt = $1,500/month Now add that to the $1,700 in housing costs: TDS = $3,200 ÷ $7,500 = 42.7% Uh oh. Even though your GDS looks great, your TDS is just over the 42% limit. That could put your mortgage approval at risk—even if you’re paying similar or higher rent now. What Can You Do? In cases like this, small adjustments can make a big difference: Consolidate or restructure your debts to lower monthly payments Reallocate part of your down payment to reduce high-interest debt Add a co-applicant to increase qualifying income Wait and build savings or credit strength before applying This is where working with an experienced mortgage professional pays off. We can look at your entire financial picture and help you make strategic moves to qualify confidently. Don’t Leave It to Chance Everyone’s situation is different, and debt service ratios aren’t something you want to guess at. The earlier you start the conversation, the more time you’ll have to improve your numbers and boost your chances of approval. If you're wondering how much home you can afford—or want help analyzing your own GDS and TDS—let’s connect. I’d be happy to walk through your numbers and help you build a solid mortgage strategy.